Alternative Investments Insights

January to April 2019

Wednesday, 06/19/2019

After a challenging Q4 2018, we witnessed one of the best starts to the year for hedge funds since 2006.

June 19, 2019
Cédric Vuignier Head of Manager Research
Christophe Campana Senior Analyst
  • One of the best starts to the year for hedge funds since 2006
  • After a challenging Q4 2018, the beginning of 2019 saw four months of uninterrupted equity progress and tightening credit spreads
  • Trend followers were best-in-class over the period, capitalising on strong uptrends in bonds and equities
  • Trade war tensions weighed again on M&A deals
  • Fixed income and volatility arbitrageurs in full risk implementation mode
  • Volatility dispersion is becoming a recurring allocation topic

THE SITUATION SO FAR

We witnessed one of the best starts to the year for the hedge fund industry since 2006, thanks to Federal Reserve chair Jerome Powell. Generally, hedge funds have trouble handling strong equity v-shaped scenarios. However, the recovery which started on 24 December has lasted long enough for equity managers to once again deploy risk, and this has acted as a tailwind for trend followers too. Market neutral funds and volatility arbitrageurs somewhat struggled over the period, due to factor and sector rotations and volatility compression, respectively.

Our flagship uncorrelated strategy – with a bias to relative value and macro strategies – was strongly up in January, after an exceptionally positive month of December and positive yearly performance. Relative value managers benefited from the dislocation and opportunities triggered by the stress of Q4 2018. It is therefore no surprise it was nominated for best fund of hedge funds for the HFM European Hedge Fund Performance Award 2019.

There are no changes to our strategy views. We still have a portfolio bias to benefit from higher levels of volatility. The low volatility of the last few months should hopefully not persist, with ongoing sources of tension worldwide, slower expected growth and lower liquidity in the markets – mainly in credit. As a result, we are not planning any major changes to our strategy allocation in the near future, but we expect to diversify our fixed income arbitrage allocation – in particular, MBS agency arbitrage.

We have highlighted our approach toward the volatility sector at the end of this document.

MACRO

The beginning of 2019 was overall quite detrimental to discretionary global macro managers. This is a recurring theme, which has gone on for too long - as a result, many investors are becoming impatient and cutting allocations. Nonetheless, our managers proved resilient, by being tactical in terms of trading and deploying low risk. However, there was no specific consensus on allocation. Most will remain extremely careful for the coming months, as they are unable to find a rationale for the rally in equities and a clear fundamental picture.

After two strong months for equities, March saw rising concerns on global growth, the US yield curve inversion and a dovish Fed add to fears of a potential US recession. Notably, the long bond strategy was rewarded and trend followers were able to deliver strongly, while systematic macro managers, particularly ones with a short-term focus, also delivered, but across a more diversified asset base. The flat trend in equities was short-lived and resumed sharply in April, benefiting the long exposure of trend followers, while discretionary managers were more muted.

Our outlook

There are no changes to our outlook for the discretionary and systematic silos, reiterating our preference toward relative value allocation and shorter-term trading horizons for systematic managers. Nevertheless, a more-dovish-than-expected Fed could extend the uptrend in equity and credit cycles and benefit directional managers.

Investors are now pricing a 80% probability of a rate cut in 2019
Source
Bloomberg. Data from May 2018 to April 2019

EQUITY HEDGE

After a challenging Q4 2018 for equity markets, the start of 2019 was bullish – equities posted four months of uninterrupted progress. The best-performing global sectors were IT, consumer discretionary, industrials and communication services – the newly-created sector which includes companies such as Facebook, Alphabet and Netflix.

The first stage of the v-shaped recovery had a mixed effect on equity long/short managers, as many of them reduced net and gross exposures in the last months of 2018 and were thus not able to fully catch the sudden rebound. Nevertheless, most have quickly adjusted their portfolios to the new environment and increased risk through additional leverage and market exposure. Since a lot of shorts had to be covered in the market, this further fuelled the uptrend and helped managers with a longer net bias. Unfortunately, at the same time, sector leadership changed from defensive to growth managers and hit quant multi-factor market neutral funds that integrate momentum and style reversal in their models.

Our outlook

Many equity long/short managers have readjusted their portfolios to the improved trading environment by increasing gross and net exposures. We expect a very tactical year with potential market hiccups, which would favour managers that have the ability to quickly adjust market exposure and risk.

No homogeneity in TMT in the last 3 years: Tech doubled, Telecom flat
Source
SYZ Asset Management, Bloomberg. Data from April 2016 to April 2019

EVENT DRIVEN

In the first four months of the year, event-driven strategies posted strong performance in an environment of rallying equity markets. Some strategies struggled mid-period, such as distressed/restructuring funds, particularly those with an allocation to emerging markets.

Activism was the top performing strategy in the space, as managers who tend to hold highly concentrated and net long exposures to equities managed to capture a good portion of the equity rally. Activists were particularly exposed to top performing sectors for the period, such as consumer, IT and financials.

Merger arbitrage was one of the worst – yet positive – event-driven performers over the review period. A quite unfavourable environment, with low merger arbitrage volumes and spreads at tight levels – not seen since late 2013 – pushed managers to keep reducing overall leverage, decreasing the potential for returns even further. Unlike Q4 2018, the strategy was not impacted by any major deal breaks.

Our outlook

Businesses remain cautious regarding M&A, which did not help volumes and the opportunity set for merger arbitrageurs. Having reduced leverage, we do not think managers will be able to post interesting profits in this environment of tight spreads. We remain cautious on long-biased strategies such as activism, as uncertainty around Brexit and US-China tensions could harm equity markets.

Annualized Median Excess M&A Spreads
Source
Bloomberg, UBS. Data from October 2013 to April 2019

RELATIVE VALUE

After one of the worst years for credit in a long time, the first four months of the year witnessed a strong rally in spreads, allowing managers with more beta to deliver strongly – the lowest tranches being more supportive. As such, even with low risk budgets, managers with a higher gross exposure performed well, while credit-neutral managers lagged somewhat.

Positioning remained idiosyncratic, but we saw an increasing concentration in healthcare and IT for convertible US arbitrageurs. Similar to 2018, fixed income arbitrage managers went on to deliver, by fully implementing risk, reallocating some basis risk away from Germany – back to the US – and increasing allocation to swap spreads. The picture for volatility arbitrage is more complex. Low levels of volatility and the equity rally are detrimental to volatility premiums arbitrageurs, as the hedging is too costly, but those focused on rates and US equity dispersion were resilient.

Our outlook

We kept diversifying our allocation in favour of capital arbitrage and added long vega managers with low theta bleeding – to mitigate the impact of large equity sell-offs. Convertible arbitrage is our preferred way of keeping some directionality in our defensive portfolios.

Average bid price on the HY index
Source
Bloomberg Barclays, Haver Analytics, Goldman Sachs Goldman Investment Research. Data as of: April 2019

OUR CONVICTIONS

Volatility is Normalising: How to Navigate the Space

Volatility is a niche area and challenging to grasp due to its embedded complexity, yet the space has become a recurring topic of discussion ever since February 2018. On February 5, 2018, the VIX (real-time measurement of the market’s expectation of future volatility in the U.S. equity market) had its largest one-day move to date and surged just over 110% to 50. Subsequently, the XIV (inverse of the VIX) collapsed, and approximately $3.2 billion of short volatility positioning was wiped out, leading to roughly $2.6 trillion of losses in the S&P 500 ($1 trillion, of which, occurred on the same day the XIV imploded). The events of February 2018 were a reminder to us all that movements in this relatively small "asset class" of volatility can, indeed, affect broader markets.

U.S. equity volatility arguably remains somewhat low today. For context, let us note several periods in the evolution in volatility. Pre-2008 can be defined as a "normal" volatility environment, with some hedging demand from market participants, followed by periods of even higher hedging demands. Then, from 2012 to January 2018, we saw a relatively more muted volatility environment, even though realised volatility reached a floor during the summer of 2017 and experienced some sharp (albeit short-lived) volatility spikes.

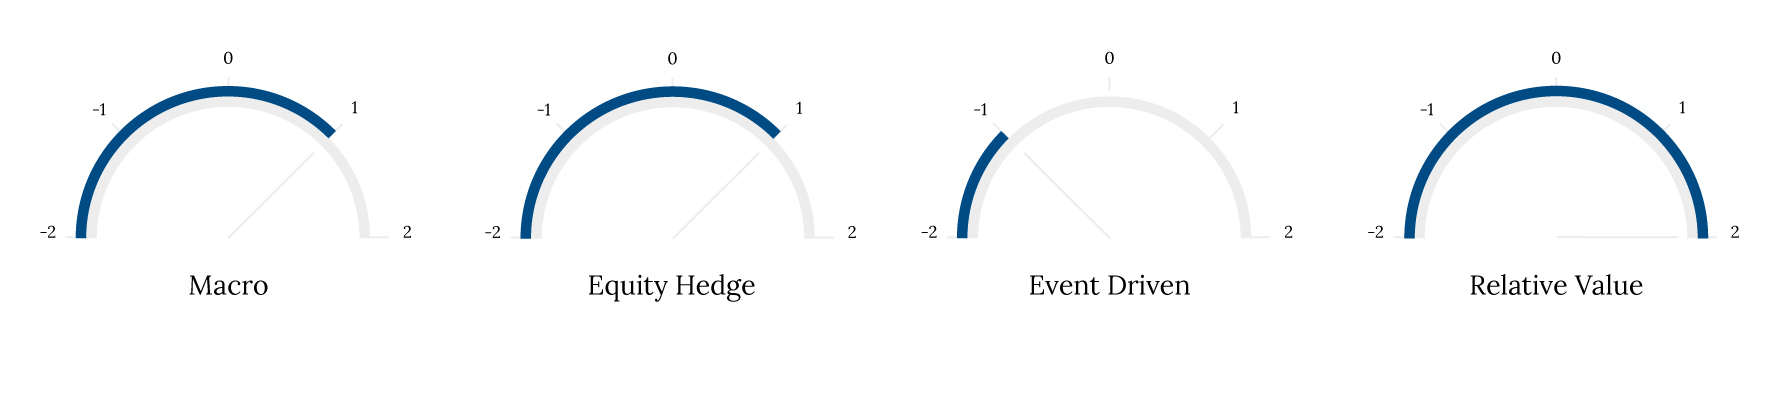
As seasoned portfolio managers, we are well aware of the need to distinguish between the trading opportunity set and reality of markets. Thus, we are tactical in our allocation to volatility and have various tools at our disposal to capitalise in this space, broadly across four styles: tail risk, long volatility bias, relative value, and short volatility.

Tail risk hedging is usually theta consuming and difficult to time, and over the years, we have learned the hard way in this area and now generally avoid these strategies. Issues with shorting volatility are referenced above, and thus are exposures that we aim to stay away from even if some of our managers can (and do) employ temporary short biases.

Notwithstanding, we frequently implement relative value as (a core part of our portfolios) and, on an opportunistic basis, long volatility bias strategies. The former targets an uncorrelated, diversifying, all-weather return stream while the latter aims to generate positive returns with a negative beta. In particular, we like relative value managers due to their dynamic allocation across global asset classes and strategies.

As there are many different approaches to gain exposure to volatility, we will address one strategy where we see a growing opportunity set: dispersion. Dispersion seeks to take advantage of relative value differences in implied volatilities by shorting an index and going long a basket of the index’s constituent stocks. Due to demand for hedging, index options tend to trade at a higher implied-to-delivered volatility premium than single stock options. As a result, implied correlation also typically trades at a premium to delivered correlation.

Dispersion usually works well during times of market segmentation, temporary shifts in correlation between assets, and idiosyncratic news on individual stocks. Generally, the most supportive environments for dispersion are when volatility increases and remains elevated such as 1999, 2000, 2008, and Q4 2018. Regarding 2018 specifically, while volatility was higher than 2017, note that volatility in 2018 was still just below the 20 year VIX average (pre-2017 and excluding 2008) of approximately 18.

Given the collapse of the XIV in February 2018, U.S. equity markets may go back to a more "normal" volatility environment by historical standards. One could argue, for instance, that the XIV kept an artificial lid on U.S. equity volatility. Further, while volatility has generally been constrained by quantitative easing programmes, industry consensus points toward a continuation of the upward trend in volatility with the implicit put by central banks weakening.